

Health & Safety Data Analytics & Power BI
Turn your health and safety data into clear, actionable insights - with custom Power BI dashboards, Power Apps and automated reporting within your Microsoft 365 environment.
Explore What’s PossibleData-Driven Safety Management
Most organisations collect health and safety data - incident reports, near-miss logs, audit findings, training records, inspection results - but few turn that data into meaningful insights. Spreadsheets grow unwieldy, reports take hours to compile and trends go unnoticed until it’s too late.
Our data analytics service changes that. Using the Microsoft Power Platform - Power BI, Power Apps and Power Automate - we build custom solutions that sit within your existing Microsoft 365 ecosystem. No new software to buy, no complex integrations, no steep learning curve for your team.
This is a genuinely new offering in the Health & Safety consultancy space. While other providers stop at spreadsheets and PDFs, we give you live dashboards, automated workflows and mobile data capture that transform how you manage safety.
What We Build
Power BI Safety Dashboards
Interactive dashboards that visualise your Health & Safety data in real time. Track incident rates, near-miss trends, audit scores, training compliance and leading indicators across sites and time periods. Share dashboards securely within Teams or embed them in SharePoint.
Power Apps for Data Capture
Custom mobile apps for workplace inspections, incident reporting, near-miss capture, toolbox talk sign-off and permit to work management. Replace paper forms and spreadsheets with structured, validated data entry that feeds directly into your reporting.
Power Automate Workflows
Automated notifications, escalation workflows and approval processes. When an incident is reported, the right people are notified immediately. When an action is overdue, reminders are sent automatically. When a trend crosses a threshold, management is alerted.
SharePoint Integration
Centralised document management for policies, risk assessments, COSHH assessments and safe systems of work. Version control, access permissions and search functionality built on your existing Microsoft 365 tenant.
Dashboard Capabilities
Our Power BI dashboards can be configured to track any combination of Health & Safety metrics relevant to your business. Common dashboard views include:
Incident & Near-Miss Analytics
- Incident frequency rates (LTIFR, TRIFR) with trend analysis
- Near-miss to incident ratios by department, site or time period
- Root cause analysis breakdowns
- Days since last lost-time incident by site
- Severity distribution and injury type analysis
Audit & Inspection Performance
- Audit scores by site, department or standard
- Action close-out rates and overdue action tracking
- Non-conformance trends by category
- Inspection completion rates against schedule
Training & Competence
- Training compliance by role, site and qualification
- Certificate expiry tracking and renewal forecasting
- Training completion rates for mandatory courses
- Competence matrix heat maps
Leading Indicators
- Safety observation rates and behavioural safety trends
- Proactive vs reactive metrics ratio
- Management safety engagement tracking
- Contractor safety performance scorecards
Dashboard Examples
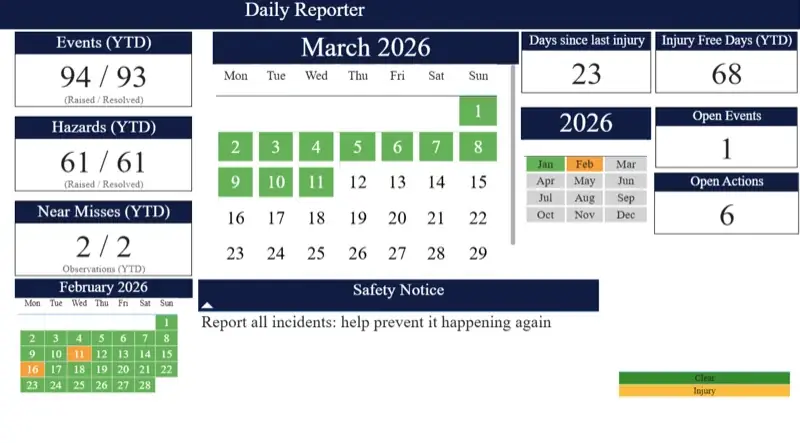
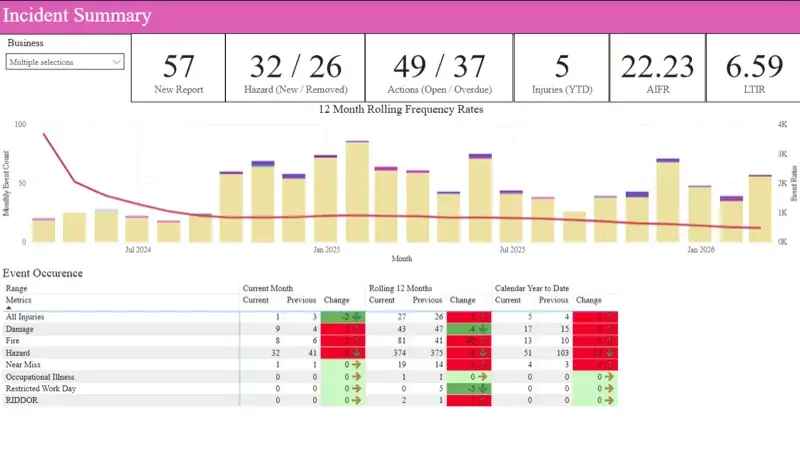
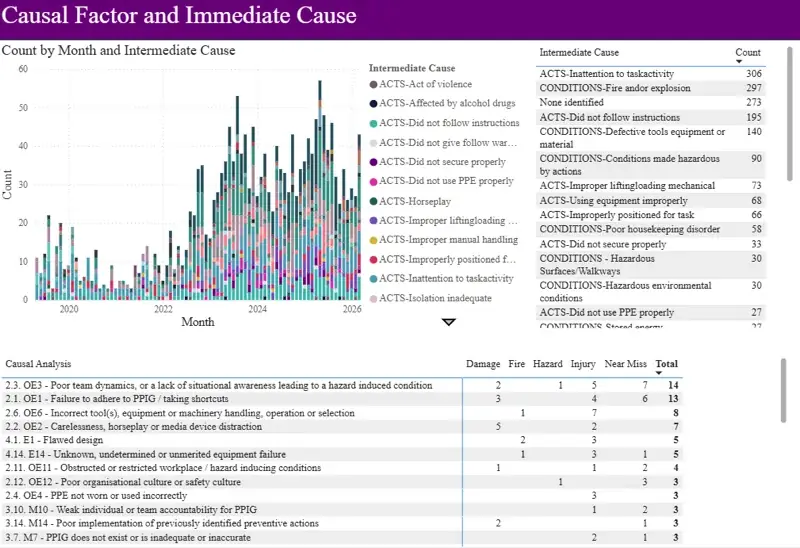
We tailor every dashboard to your organisation’s data and KPIs. Contact us to see a live demonstration.
How It Works
Discovery & Data Audit
We review your current data sources, reporting processes and M365 environment. We identify what data you already collect, where the gaps are and what insights would be most valuable to your business.
Solution Design
We design the dashboard layouts, data models, app interfaces and automation workflows. You see mockups and approve the design before we build anything.
Build & Configure
We build your Power BI reports, Power Apps and Power Automate flows within your Microsoft 365 tenant. Everything is configured, tested and validated against your real data.
Training & Handover
We train your team to use the dashboards, apps and workflows. Full documentation is provided. We offer ongoing support packages for updates and enhancements as your needs evolve.
Why Microsoft 365?
We build exclusively within the Microsoft Power Platform because it offers significant advantages for Health & Safety data management:
- No additional licensing - Power BI, Power Apps and Power Automate are included in most Microsoft 365 business plans
- Familiar environment - your team already uses Teams, Outlook and SharePoint every day
- Enterprise security - data stays within your M365 tenant with your existing security policies and access controls
- Mobile access - Power Apps and Power BI mobile apps give field teams access to data capture and dashboards on any device
- Scalable - start with one dashboard and expand as you see value. Add sites, metrics and users without infrastructure changes
- No vendor lock-in - everything we build belongs to you, within your own tenant. You’re not dependent on a third-party SaaS platform
Get in Touch
Ready to see what your Health & Safety data can tell you? Book a discovery call and we’ll show you what’s possible with Power BI and M365.