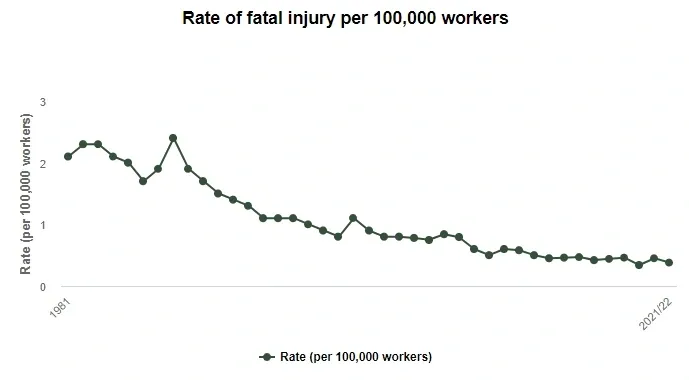
The Health and Safety Executive (HSE) have recently released their provisional figures for work-related fatalities in the year 2021/2022 – We will have to wait for the final figures to be published in July 2023.
Based on these provisional figures 123 workers were killed during this time – Let that just sink in for a moment. 123. That is the equivalent to all of the 6 nations starting 15 and 5 of the 6 teams’ replacements. That sounds horrific!
Rugby analogies aside when we look at the numbers more closely we see the industries that have been impacted and find it equally as eye watering.
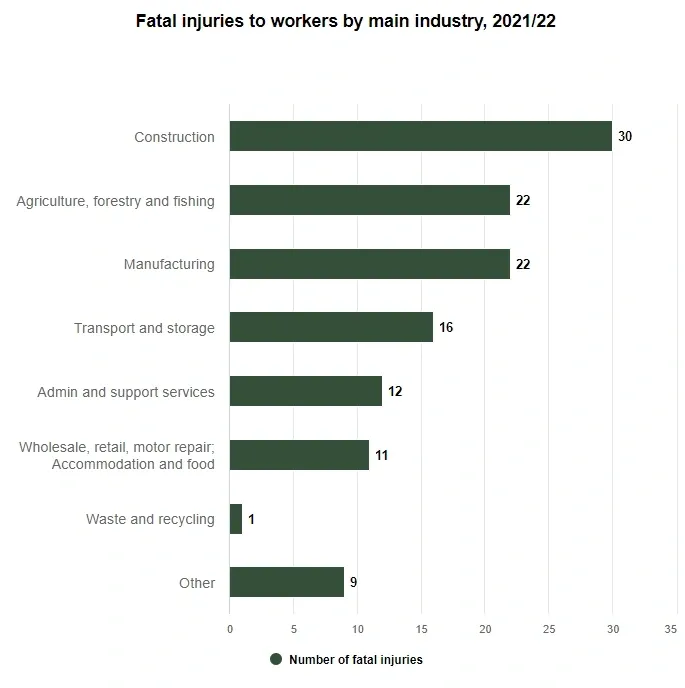
Construction has seen the highest, followed by agriculture, forestry and farming, followed by manufacturing. It was interesting to see that the waste and recycling industry has sustained one of the lowest and considering the high risk nature of the industry it looks like those folk are doing something different over the last few years.
Our Principal Consultant, Jonathan, has spent 16-years in the waste and recycling industry with differing sizes of organisations and had this to say
‘Over the years I have had in the waste and recycling industry I have seen massive changes not only to standards and working practices – Those who remember foot plates on bin lorries or the fine art of ‘totting’ at your local tip are prime examples of where the industry have evolved. There appears to be a culture shift in peoples awareness of risk and what it means to them – An awareness of the consequence on themselves should they be involved in an incident or not be in a fit state to work or enjoy the pleasures of life.’. It may have something to do with the Waste Industry Safety & Health (WISH) Forum and their strategy to support the industry
Where Risk Lies
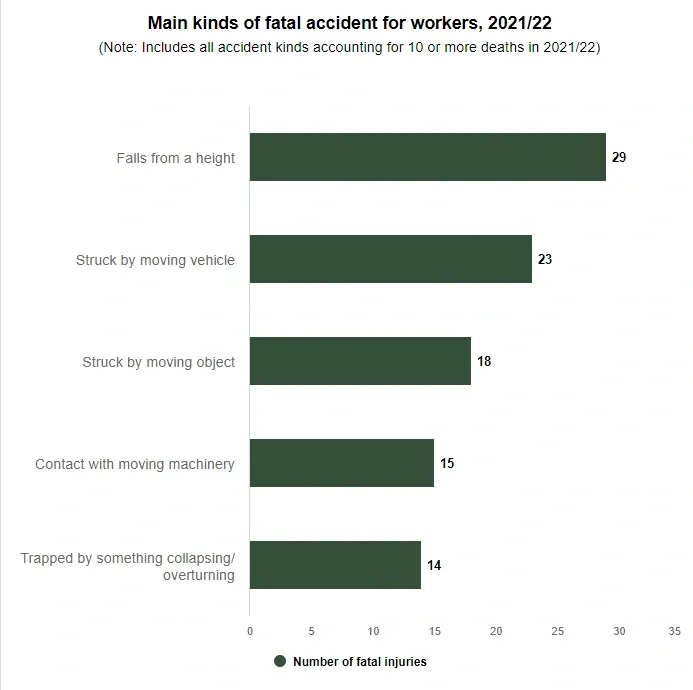
As with the industries that have sustained fatal incidents what caused them was equally interesting to see. HSE’s top 5 provisionally tells us that working at height, vehicle, plant and pedestrian segregation, falling or projectile objects, machinery risks or becoming trapped still remain high on the list. We, at Serene Safety at least, call these the basic, tangible safety risks that are well known and have a plethora of control measures and support in place to prevent so why do they still remain?
Treat Health Like Safety
What we do not see, because it is not as clear cut as the more physical side of fatal injuries’ are those more related to Psycho-social risks such as stress, anxiety, depression within the workplace or occupational health conditions that have a long latency period such as silicosis or mesothelioma. These ‘silent killers’ do not feature in these figures from what we can see however should not be discounted as a job well done. We need to remain cognizant of health so when we say ‘treat health like safety’ what we mean is placing as much emphasis on health risks in the workplace as we do with the ‘physical’ aspects of safety.
Only Part of the Puzzle
Arbitrary raw data such as the figures quoted above are only part of the puzzle and, whilst shocking to see, do not give a true representation of industry as a whole – It’s a blunt instrument and very much rear view mirror stuff. We can’t do much about the events that have already taken place. Forward looking indicators allow industry to horizon scan and, dare I say it, predict where their potential incidents are likely to be.
The concept of leading and lagging indicators is not a new concept and there are far more involving posts and papers than this blog that do well to break it down for the discerning readers out there.
In conclusion, whilst there have been gains within industry as a whole there is still a long road ahead to get this figure below 100, 50, 10 and the ultimate goal of 0.
Look out for our upcoming blog on ‘Target Zero – Achievable or setting up to fail?’